
1 Data analysis: purposes and applications
Learning Objectives
- Explain the purposes of data analysis
- Describe data analysis tools and tasks
- Identify data analysis software
Introduction
The purpose of data analysis is to create insights that can improve decision making. Data analysis is used in many fields and has been glamorized in compelling stories like “Moneyball” (2011) or “21” (2008). This chapter presents purposes of data analysis, how tools and tasks are used throughout the data analytics process, and software that is used for the analysis.
Purposes of data analysis
Data analysis is a broad set of statistical, econometric, and machine learning tools that can improve decision making. Data analysis as a decision making tool for companies, AKA “data-driven decision making”, may improve performance.[1] Using data analysis to make company decisions grew as computing technology developed and data became more widely available [2]
Data analysis can aid decision makers in various ways. For example, exploratory data analysis can describe resources and performance for different business segments, different locations, or different time periods. Modeling business outcomes can uncover profitability drivers. The information from careful data analysis can give decision makers new information that they did not already have, challenge assumptions and beliefs, and uncover insights that are not easy to uncover in other ways.
Data analysis might be grouped into the following broad categories. Click to read about each category.
Specific tools for these types of analytics will be discussed later in the chapter.
Applying data analysis to decision making
To improve decision making, data analysis must improve the information that decision makers have. Decision making theory (Bayesian learning) provides a framework for understanding when and how data analysis can improve decision making.
In Bayesian learning, the following are the important factors that determine the usefulness of new information from a decision making perspective:
Using these points from decision theory, consider scenarios that might make data analysis more or less useful to decision makers. Click on the different scenarios to learn about the usefulness of new information.
This framework provides important questions for any data analysis project.
- What does the decision maker know before starting the project?
- How precise will the information from the data analysis be?
- Will the information from the data analysis be sufficiently precise so that it improves the information the decision maker has?
Data analysis tools and tasks
While broadly speaking data analysis may focus on specific objectives, there are also steps in a data analysis project that may be necessary regardless the focus of the analysis. These steps are part of a data analysis workflow. The flowchart below provides steps to a data analysis project. Not all steps will be used for every project and the project may not proceed linearly through this flowchart, but all projects contain at least one part and many projects contain multiple parts of the workflow.
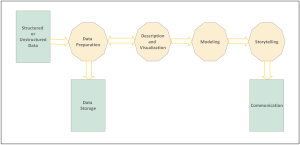
The flowchart shows the following components of the data analytics process. Click through the components to learn about each step.
Software
There is a large and growing set of options for data analytics. Which software you use may depend on the type of analysis you do most frequently, the size of the data sets, the learning curve for the software, the software community, and the budget you have.
Some software are easy to use and have the largest user base (Microsoft Excel). Other software are less broadly used and require additional learning but fulfill specific functions well (Tableau, PowerBI). Some advancements in language models make chat-based data analysis possible. Each software has its own strengths and weaknesses. Most data scientists use general purpose software like python, R, Matlab, Stata, or SAS. These types of software can handle larger data sets, are more efficient, and can be used for most tasks. These types of software also have large user communities and can be open source.
Conclusion
In this chapter, you learned about the purposes of data analysis. You learned how data analysis is used to make decisions. You learned about the data analytics process and some tools and software. The next two chapters will focus on data analytics in an accounting setting with accounting data.
Mini-case video
Video source material:
Lucky CEOs and Lucky Directors – BEBCHUK – 2010 – The Journal of Finance – Wiley Online Library
Review
Review data analytics process
Questions
- Summarize the purpose of data analytics
2. When is data analysis likely to be useful?
References
Brynjolfsson, E., Hitt, L. M., & Kim, H. H. (2011). Strength in numbers: How does data-driven decisionmaking affect firm performance?. Available at SSRN 1819486.
Brynjolfsson, E., & McElheran, K. (2016). The rapid adoption of data-driven decision-making. American Economic Review, 106(5), 133-139. https://www.aeaweb.org/articles?id=10.1257/aer.p20161016.
Kunc, M., & O’brien, F. A. (2019). The role of business analytics in supporting strategy processes: Opportunities and limitations. Journal of the Operational Research Society, 70(6), 974-985. https://www.tandfonline.com/doi/full/10.1080/01605682.2018.1475104.
Media Attributions
- Data analysis process (1)