
Section 4.1 Answers
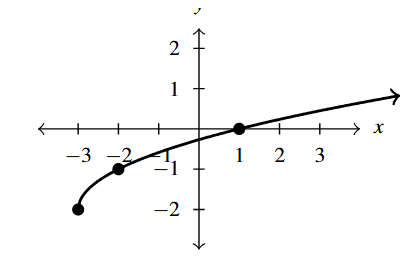
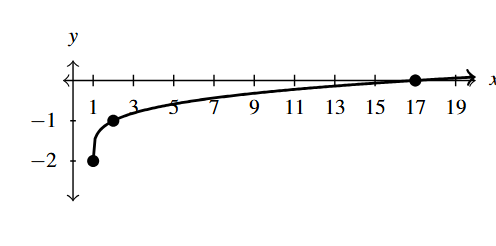
- [latex]F(x) = \sqrt{x+3}-2[/latex]
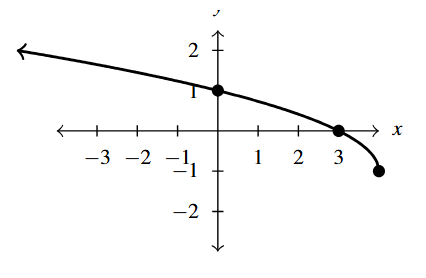
Answer to Exercise 1 - [latex]F(x) = \sqrt{4-x}-1 = \sqrt{-x+4} - 1[/latex]
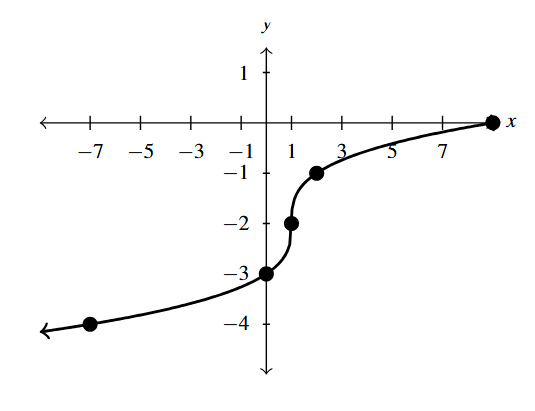
Answer to Exercise 2 - [latex]F(x) = \sqrt[3]{x-1}-2[/latex].
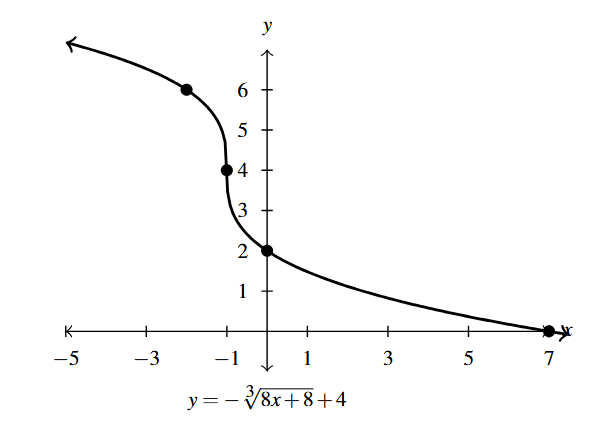
Answer to Exercise 3 - [latex]F(x) = -\sqrt[3]{8x + 8} + 4[/latex]
Answer to Exercise 4 - [latex]F(x) = \sqrt[4]{x-1}-2[/latex]
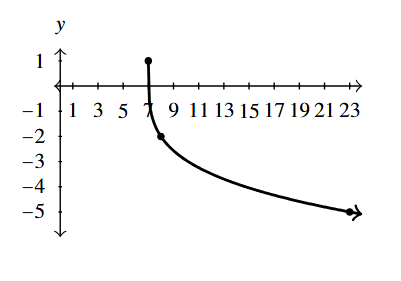
Answer to Exercise 5 - [latex]F(x) = -3\sqrt[4]{x - 7} +1[/latex]
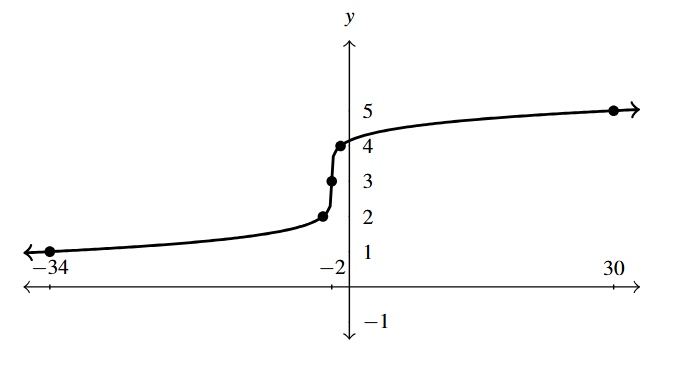
Answer to Exercise 6 - [latex]F(x) = \sqrt[5]{x + 2} + 3[/latex]
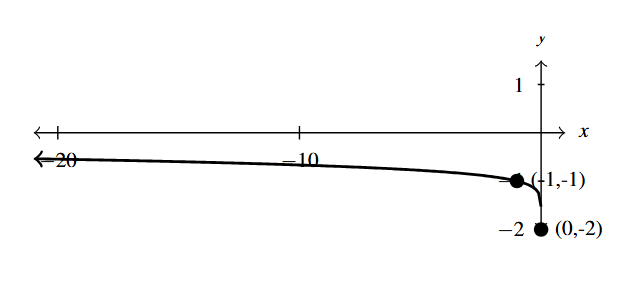
Answer to Exercise 7 - [latex]F(x) = \sqrt[8]{-x} - 2[/latex]
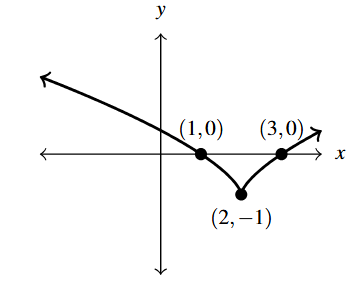
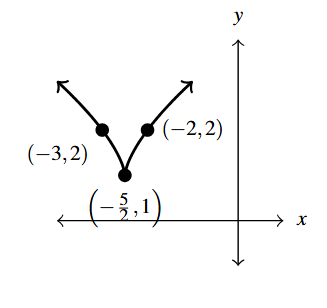
Answer to Exercise 8 - One solution is: [latex]F(x) = -\sqrt{x+4}+2[/latex]
- One solution is: [latex]F(x) =2\sqrt{-x+1}[/latex]
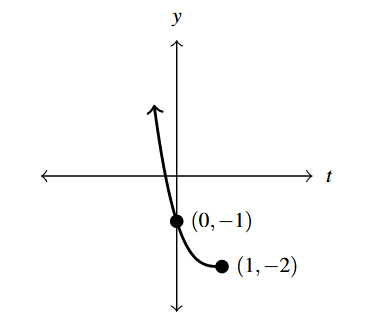
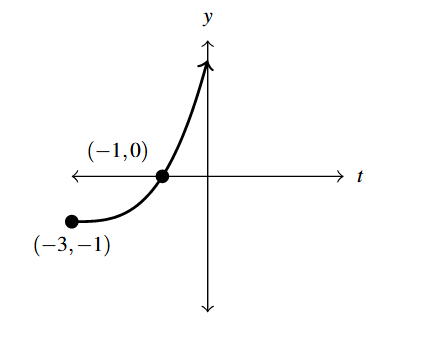
- One solution is: [latex]F(x) = -\sqrt[3]{2x+1}[/latex]
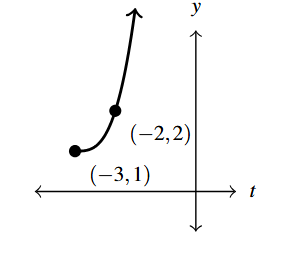
- One solution is: [latex]F(x) =2\sqrt[3]{x-1}-2[/latex]
- .
- [latex](-\infty, 4][/latex]
- [latex](-2, \infty)[/latex]
- [latex]\left[ \frac{1}{2}, \infty \right)[/latex]
- [latex][-2,2][/latex]
- [latex](-\infty, -2) \cup (2, \infty)[/latex]
- [latex](-\infty, -2] \cup [1, \infty)[/latex]
- [latex]f(x) = \sqrt{1 - x^2}[/latex]
- Domain: [latex][-1, 1][/latex]
- Intercepts: [latex](-1,0)[/latex], [latex](1,0)[/latex]
- Graph:
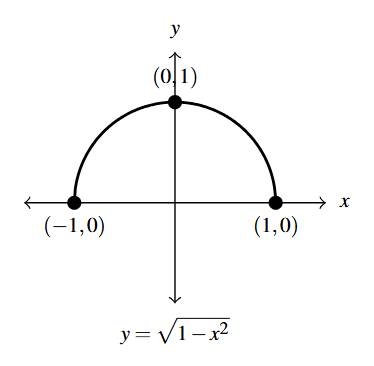
Graph Answer to Exercise 14 - Range: [latex][0,1][/latex]
- Local maximum: [latex](0,1)[/latex]
- Increasing: [latex][-1,0][/latex], Decreasing: [latex][0,1][/latex]
- Unusual steepness[1] at [latex]x = -1[/latex] and [latex]x = 1[/latex]
- Sign Diagram:
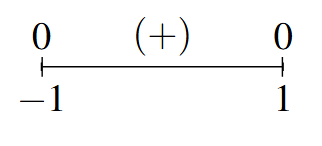
Sign Diagram Answer to Exercise 14 - Note: [latex]f[/latex] is even.
- [latex]f(x) = \sqrt{x^2-1}[/latex]
- Domain: [latex](-\infty, -1] \cup [1,\infty)[/latex]
- Intercepts: [latex](-1,0)[/latex], [latex](1,0)[/latex]
- Graph:
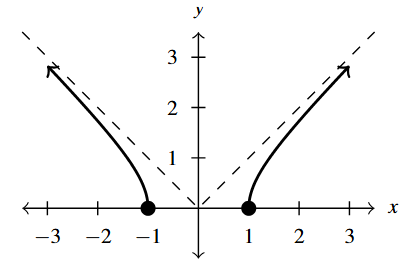
Graph Answer to Exercise 15 - As [latex]x \rightarrow \pm \infty[/latex], [latex]f(x) \rightarrow \infty[/latex]
- Range: [latex][0, \infty)[/latex]
- Increasing: [latex][1, \infty)[/latex]
- Decreasing: [latex](-\infty, -1][/latex]
- Unusual steepness[2]at [latex]x = -1[/latex] and [latex]x = 1[/latex]
- Using Calculus, one can show [latex]y = \pm x[/latex] are slant asymptotes to the graph.
- Sign Diagram:
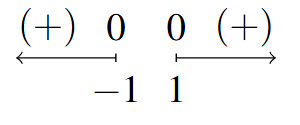
Sign Diagram Answer to Exercise 15 - Note: [latex]f[/latex] is even.
- [latex]g(t) = t\sqrt{1-t^2}[/latex]
- Domain: [latex][-1,1][/latex]
- Intercepts: [latex](-1,0)[/latex], [latex](0,0)[/latex], [latex](1,0)[/latex]
- Graph:
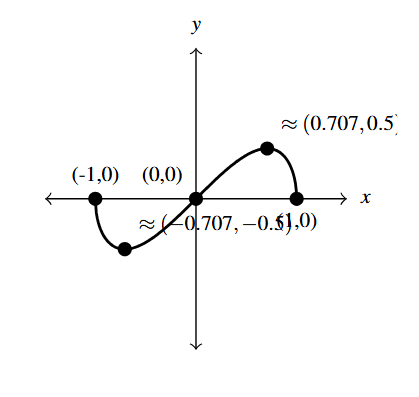
Graph Answer to Exercise 16 - Range: [latex]\approx [-0.5, 0.5][/latex]
- Local minimum [latex]\approx (-0.707, -0.5)[/latex]
- Local maximum: [latex]\approx (0.707, 0.5)[/latex]
- Increasing: [latex]\approx [-0.707, 0.707][/latex]
- Decreasing: [latex]\approx [-1, -0.707][/latex], [latex][0.707, 1][/latex]
- Unusual steepness at [latex]t = -1[/latex] and [latex]t = 1[/latex]
- Sign Diagram:
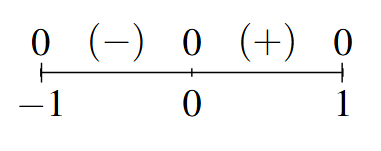
Sign Diagram Answer to Exercise 16 - Note: [latex]g[/latex] is odd.
- [latex]g(t) = t\sqrt{t^2-1}[/latex]
- Domain: [latex](-\infty, -1] \cup [1,\infty)[/latex]
- Intercepts: [latex](-1,0)[/latex], [latex](1,0)[/latex]
- Graph:
Graph Answer to Exercise 17 - As [latex]t \rightarrow -\infty[/latex], [latex]g(t) \rightarrow -\infty[/latex]
- As [latex]t \rightarrow \infty[/latex], [latex]g(t) \rightarrow \infty[/latex]
- Range: [latex](-\infty, \infty)[/latex]
- Increasing: [latex](-\infty, -1][/latex], [latex][1, \infty)[/latex]
- Unusual steepness at [latex]t = -1[/latex] and [latex]t = 1[/latex]
- Sign Diagram:
Sign Diagram Answer to Exercise 17 - [latex]g[/latex] is odd.
- [latex]f(x) = \sqrt[4]{\dfrac{16x}{x^2 - 9}}[/latex]
- Domain: [latex](-3, 0] \cup (3, \infty)[/latex]
- Intercept: [latex](0,0)[/latex]
- Graph:
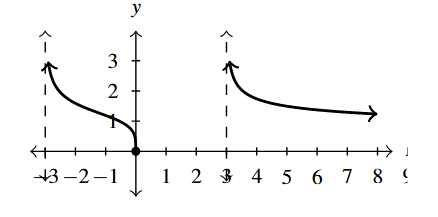
Graph Answer to Exercise 18 - As [latex]x \rightarrow \infty[/latex], [latex]f(x) \rightarrow 0[/latex]
- Range: [latex][0, \infty)[/latex]
- Decreasing: [latex](-3, 0][/latex], [latex](3, \infty)[/latex]
- Unusual steepness at [latex]x = 0[/latex]
- Vertical asymptotes: [latex]x = -3[/latex] and [latex]x = 3[/latex]
- Horizontal asymptote: [latex]y = 0[/latex]
- Sign Diagram:
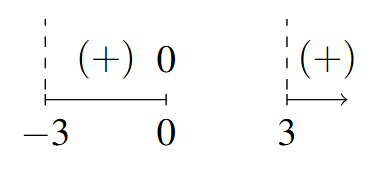
Sign Diagram Answer to Exercise 18
- [latex]f(x) = \dfrac{5x}{\sqrt[3]{x^{3} + 8}}[/latex]
- Graph:
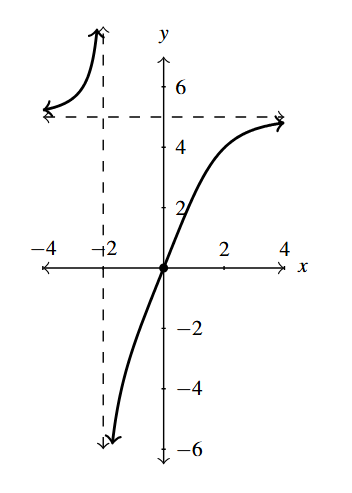
Graph Answer to Exercise 19 - Domain: [latex](-\infty, -2) \cup (-2, \infty)[/latex]
- Intercept: [latex](0,0)[/latex]
- As [latex]x \rightarrow \pm \infty[/latex], [latex]f(x) \rightarrow 5[/latex]
- Range: [latex](-\infty, 5) \cup (5, \infty)[/latex]
- Increasing: [latex](-\infty, -2)[/latex], [latex](-2, \infty)[/latex]
- Vertical asymptote [latex]x = -2[/latex]
- Horizontal asymptote [latex]y = 5[/latex]
- Sign Diagram:
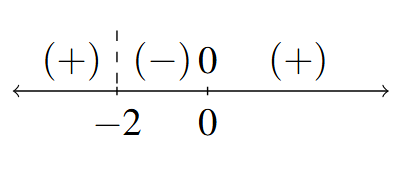
Sign Diagram Answer to Exercise 19
- Graph:
- [latex]g(t) = \sqrt{t(t + 5)(t - 4)}[/latex]
- Domain: [latex][-5, 0] \cup [4, \infty)[/latex]
- Intercepts [latex](-5,0)[/latex], [latex](0,0)[/latex], [latex](4,0)[/latex]
- As [latex]t \rightarrow \infty[/latex], [latex]g(t) \rightarrow \infty[/latex]
- Graph:
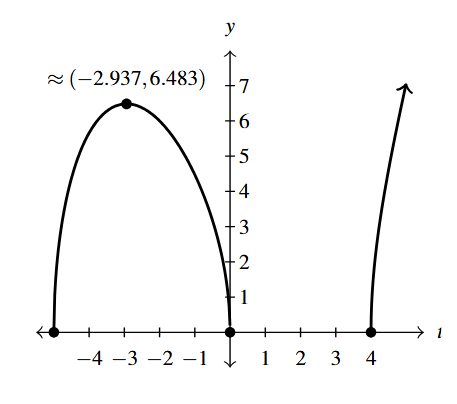
Graph Answer to Exercise 20 - Range: [latex][0, \infty)[/latex]
- Local maximum [latex]\approx (-2.937, 6.483)[/latex]
- Increasing: [latex]\approx [-5, -2.937][/latex], [latex][4, \infty)[/latex]
- Decreasing: [latex]\approx [-2.937,0][/latex]
- Unusual steepness at [latex]t = -5, t = 0[/latex] and [latex]t = 4[/latex]
- Sign Diagram:
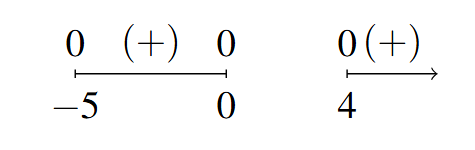
Sign Diagram Answer to Exercise 20
- [latex]g(t) = \sqrt[3]{t^{3} + 3t^{2} - 6t - 8}[/latex]
- Domain: [latex](-\infty, \infty)[/latex]
- Intercepts: [latex](-4,0)[/latex], [latex](-1,0)[/latex], [latex](0,-2)[/latex], [latex](2,0)[/latex]
- Graph:
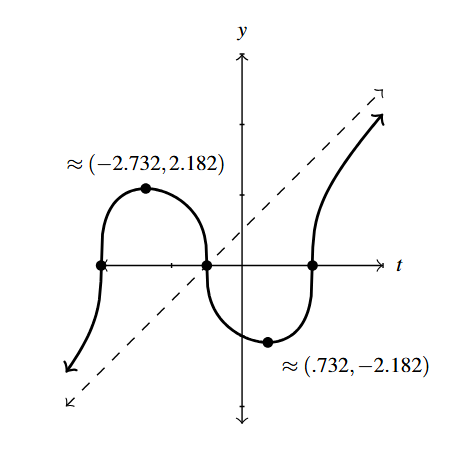
Graph Answer to Exercise 21 - As [latex]t \rightarrow -\infty[/latex], [latex]g(t) \rightarrow -\infty[/latex]
- As [latex]t \rightarrow \infty[/latex], [latex]g(t) \rightarrow \infty[/latex]
- Range: [latex](-\infty, \infty)[/latex]
- Local maximum: [latex]\approx (-2.732, 2.182)[/latex]
- Local minimum: [latex]\approx (0.732, -2.182)[/latex]
- Increasing: [latex]\approx (-\infty, -2.732][/latex], [latex][0.732, \infty)[/latex]
- Decreasing: [latex]\approx [-2.732, 0.732][/latex]
- Unusual steepness at [latex]t = -4, t = -1[/latex] and [latex]t = 2[/latex]
- Using Calculus it can be shown that [latex]y = t + 1[/latex] is a slant asymptote of this graph.
- Sign Diagram:
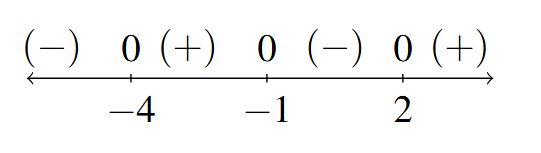
Sign Diagram Answer to Exercise 21
- [latex]C(x) = 15x+20\sqrt{100+(30-x)^2}[/latex], [latex]0 \leq x \leq 30[/latex]. The calculator gives the absolute minimum at approximately [latex](18.66, 582.29)[/latex]. This means to minimize the cost, approximately 18.66 miles of cable should be run along Route 117 before turning off the road and heading towards the outpost. The minimum cost to run the cable is approximately \$582.29.
- .
- [latex]h(r) = \frac{300}{\pi r^2}[/latex], [latex]r > 0[/latex]
- [latex]S(r) = \pi r \sqrt{r^2+\left(\frac{300}{\pi r^2}\right)^2} = \frac{\sqrt{\pi^2 r^6+90000}}{r}[/latex], [latex]r>0[/latex]
- The calculator gives the absolute minimum at the point [latex]\approx (4.07, 90.23)[/latex]. This means the radius should be (approximately) 4.07 centimeters and the height should be 5.76 centimeters to give a minimum surface area of 90.23 square centimeters.
- [latex]9.8 \left(\dfrac{1}{4\pi}\right)^{2} \approx 0.062[/latex] meters or 6.2 centimeters
- .
- [latex][0, c)[/latex]
- [latex]\begin{array}{ll} m(.1c) = \dfrac{m_{r}}{\sqrt{.99}} \approx 1.005m_{r} & m(.5c) = \dfrac{m_{r}}{\sqrt{.75}} \approx 1.155m_{r} \\ & \\ m(.9c) = \dfrac{m_{r}}{\sqrt{.19}} \approx 2.294m_{r} & m(.999c) = \dfrac{m_{r}}{\sqrt{.0.001999}} \approx 22.366m_{r} \\ \end{array}[/latex]
- As [latex]v \rightarrow c^{-}, \, m(x) \rightarrow \infty[/latex]
- If the object is traveling no faster than approximately 0.99995 times the speed of light, then its observed mass will be no greater than [latex]100m_{r}[/latex].
- [latex]k^{-1}(x) = \dfrac{x}{\sqrt{x^{2} - 4}}[/latex]
Section 4.2 Answers
- [latex]F(x) = (x-2)^{\frac{2}{3}}-1[/latex]
Answer to Exercise 1 - [latex]G(t) = (t+3)^{\pi} +1[/latex]
Answer to Exercise 2 - [latex]F(x) = 3-x^{\frac{2}{3}} = (-1)x^{\frac{2}{3}} + 3[/latex]
Answer to Exercise 3 - [latex]G(t) = (1-t)^{\pi}-2 = ((-1)t+1)^{\pi}-2[/latex]
Answer to Exercise 4 - [latex]F(x) =(2x+5)^{\frac{2}{3}}+1[/latex]
Answer to Exercise 5 - [latex]G(t) = \left( \dfrac{t+3}{2}\right)^{\pi}-1= \left( \frac{1}{2} \, t + \frac{3}{2}\right)^{\pi} -1[/latex]
Answer to Exercise 6 - One solution is: [latex]F(x) = 2(x-1)^{\frac{2}{3}}-2[/latex]
- One solution is: [latex]F(x) =-(x+1)^{\frac{2}{3}} + 4[/latex]
- [latex]f(x) = x^{\frac{2}{3}}(x - 7)^{\frac{1}{3}}[/latex]
- Domain: [latex](-\infty, \infty)[/latex]
- Intercepts: [latex](0,0)[/latex], [latex](7,0)[/latex]
- Graph:
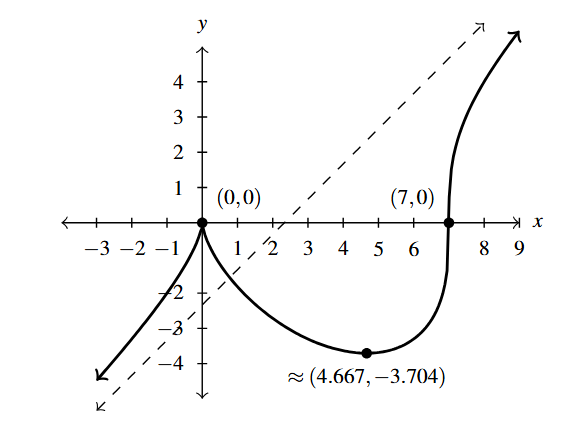
Graph Answer to Exercise 9 - As [latex]x \rightarrow -\infty[/latex], [latex]f(x) \rightarrow -\infty[/latex]
- As [latex]x \rightarrow \infty[/latex], [latex]f(x) \rightarrow \infty[/latex]
- Range: [latex](-\infty, \infty)[/latex]
- Local minimum: [latex]\approx (4.667, -3.704)[/latex]
- Local maximum: [latex](0,0)[/latex] (this is a cusp)
- Increasing: [latex](-\infty, 0][/latex], [latex]\approx [4.667, \infty)[/latex]
- Decreasing: [latex][0, 4.667][/latex]
- Unusual steepness at [latex]x = 7[/latex]
- Using Calculus it can be shown that [latex]y = x - \frac{7}{3}[/latex] is a slant asymptote of this graph.
- Sign Diagram:
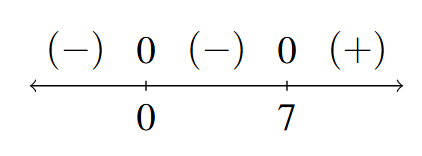
Sign Diagram Answer to Exercise 9
- [latex]f(x) = x^{\frac{3}{2}}(x - 7)^{\frac{1}{3}}[/latex]
- Domain: [latex][0, \infty)[/latex]
- Intercepts: [latex](0,0)[/latex], [latex](7,0)[/latex]
- Graph:
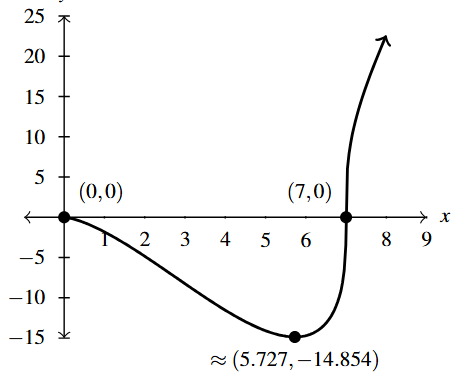
Graph Answer to Exercise 10 - As [latex]x \rightarrow \infty[/latex], [latex]f(x) \rightarrow \infty[/latex]
- Range: [latex]\approx [-14.854, \infty)[/latex]
- Local minimum: [latex]\approx (5.727, -14.854)[/latex]
- Increasing: [latex]\approx [5.727, \infty)[/latex]
- Decreasing: [latex]\approx [0, 5.727][/latex]
- Unusual steepness at [latex]x = 7[/latex]
- Sign Diagram:
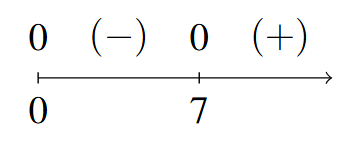
Sign Diagram Answer to Exercise 10
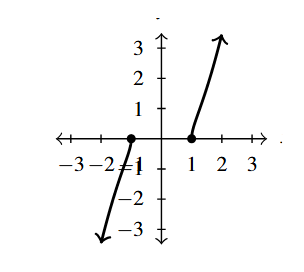
- [latex]g(t) = 2t(t+3)^{-\frac{1}{3}}[/latex]
- Domain: [latex](-\infty, -3) \cup (-3, \infty)[/latex]
- Intercept: [latex](0,0)[/latex]
- Graph:
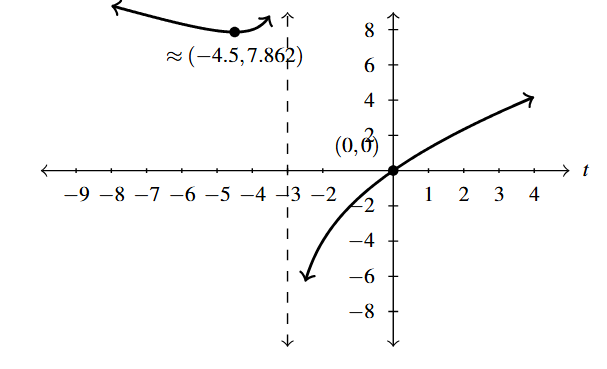
Graph Answer to Exercise 11 - As [latex]t \rightarrow \pm \infty[/latex], [latex]g(t) \rightarrow \infty[/latex]
- Range: [latex](-\infty, \infty)[/latex]
- Local minimum: [latex]\approx (-4.5, 7.862)[/latex]
- Increasing: [latex]\approx [-4.5, -3)[/latex], [latex](-3,\infty)[/latex]
- Decreasing: [latex]\approx (-\infty, -4.5][/latex]
- Vertical Asymptote: [latex]t = -3[/latex]
- Sign Diagram:
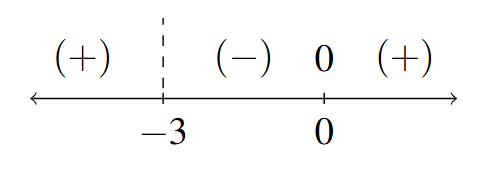
Sign Diagram Answer to Exercise 11
- [latex]g(t)= t^{\frac{3}{2}}(t-2)^{-\frac{1}{2}}[/latex]
- Domain: [latex](2, \infty)[/latex]
- Graph:
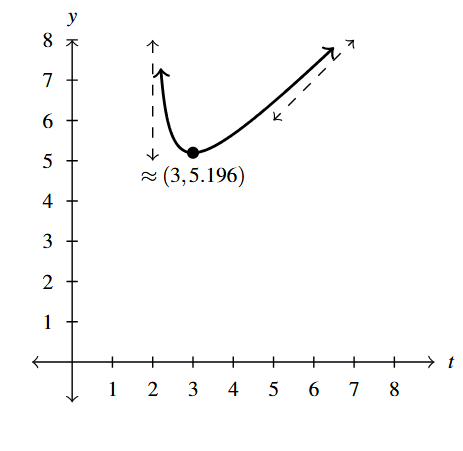
Graph Answer to Exercise 12 - As [latex]t \rightarrow \infty[/latex], [latex]g(t) \rightarrow \infty[/latex]
- Range: [latex]\approx [5.196, \infty)[/latex]
- Local minimum: [latex]\approx (3, 5.196)[/latex]
- Increasing: [latex]\approx [3, \infty)[/latex]
- Decreasing: [latex]\approx (2,3][/latex]
- Vertical asymptote: [latex]t = 2[/latex]
- Using Calculus it can be shown that [latex]y = t+1[/latex] is a slant asymptote of this graph.
- Sign Diagram:
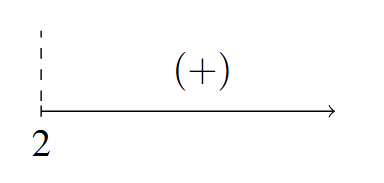
Sign Diagram Answer to Exercise 12
- [latex]f(x) = x^{0.4}(3-x)^{0.6}[/latex]
- Domain: [latex](-\infty, \infty)[/latex]
- Intercepts: [latex](0,0)[/latex], [latex](3,0)[/latex]
- Graph:
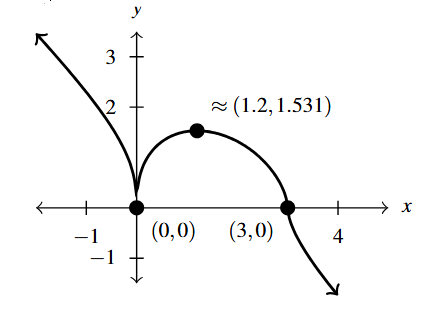
Graph Answer to Exercise 13 - As [latex]x \rightarrow -\infty[/latex], [latex]f(x) \rightarrow \infty[/latex]
- As [latex]x \rightarrow \infty[/latex], [latex]f(x) \rightarrow -\infty[/latex]
- Range: [latex](-\infty, \infty)[/latex]
- Local minimum: [latex](0,0)[/latex] (this is a cusp)
- Local maximum: [latex]\approx (1.2, 1.531)[/latex]
- Increasing: [latex]\approx [0, 1.2][/latex]
- Decreasing: [latex]\approx (-\infty, 0][/latex], [latex][1.2, \infty)[/latex]
- Unusual Steepness: [latex]x = 3[/latex]
- Sign Diagram:
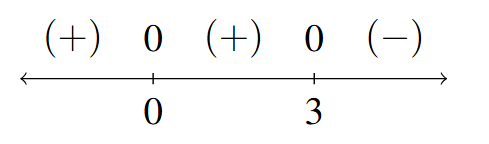
Sign Diagram Answer to Exercise 13
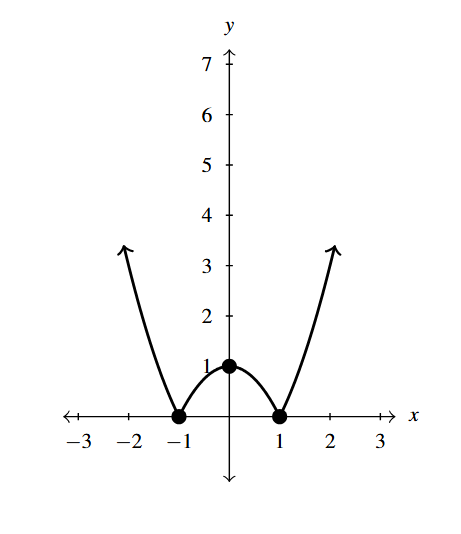
- [latex]f(x) = x^{0.5}(3-x)^{0.5}[/latex]
- Domain: [latex][0,3][/latex]
- Intercepts: [latex](0,0)[/latex], [latex](3,0)[/latex]
- Graph:
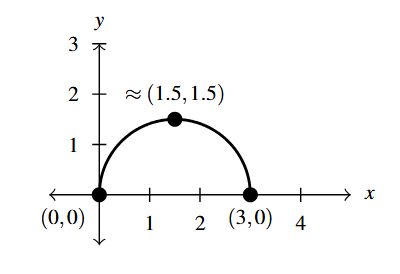
Graph Answer to Exercise 14 - Range: [latex]\approx [0, 1.5][/latex]
- Increasing: [latex]\approx [0, 1.5][/latex]
- Decreasing: [latex]\approx [1.5, 3][/latex]
- Unusual Steepness:[3] [latex]x=0[/latex], [latex]x = 3[/latex]
- Sign Diagram:
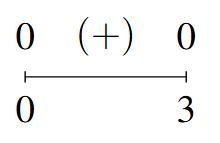
Sign Diagram Answer to Exercise 14
- [latex]g(t) = 4t (9-t^2)^{-\sqrt{2}}[/latex]
- Domain: [latex](-3, 3)[/latex]
- Intercepts: [latex](0,0)[/latex]
- Graph:
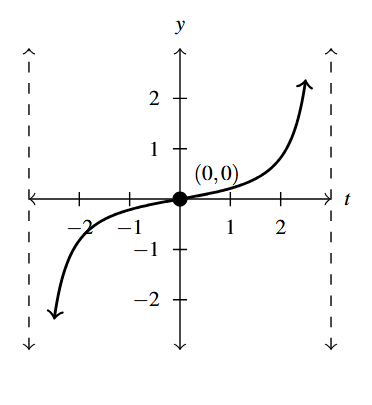
Graph Answer to Exercise 15 - Range: [latex](-\infty, \infty)[/latex]
- Increasing: [latex](-3,3)[/latex]
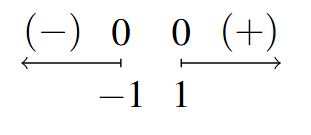
- Sign Diagram:
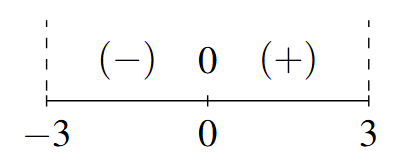
Sign Diagram Answer to Exercise 15 - Note: [latex]g[/latex] is odd
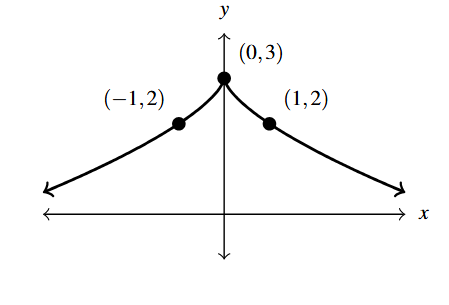
- [latex]g(t) = 3(t^2+1)^{-\pi}[/latex]
- Domain: [latex](-\infty, \infty)[/latex]
- Intercept: [latex](0,3)[/latex]
- Graph:
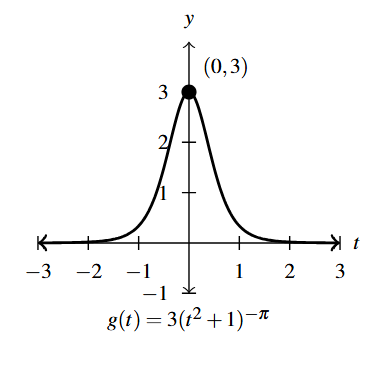
Graph Answer to Exercise 16 - As [latex]t \rightarrow \pm \infty[/latex], [latex]g(t) \rightarrow 0[/latex]
- Range: [latex](0, 3][/latex]
- Increasing: [latex](-\infty, 0][/latex]
- Decreasing: [latex][0, \infty)[/latex]
- Horizontal asymptote: [latex]y =0[/latex]
- Sign Diagram:
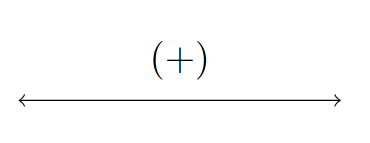
Sign Diagram Answer to Exercise 16 - Note: [latex]g[/latex] is even
- As in Exercise 51 in Section 2.2 and Exercise 22 in Section 3.2, the slopes of these curves near [latex]x=1[/latex] approach the value of the exponent on [latex]x.[/latex]
![A table with five rows and five columns. The first row is the header row: f(x), [0.9,1.1], [0.99, 1.01], [0.999, 1.001], and [0.9999, 1.0001]. The first column has the function values x raised to the one-half, x raised to the two-third, x raised to the negative 0.23, and x raised to the pi. The table is filled in.](https://odp.library.tamu.edu/app/uploads/sites/96/2025/06/Answer_4_2_17.png)
Answer to Exercise 17 - .
- [latex]W \approx 37.55^{\circ}[/latex]F
- [latex]V \approx 9.84[/latex] miles per hour
Section 4.3 Answers
- [latex]x=3[/latex]
- [latex]x = \frac{1}{4}[/latex]
- [latex]t=-3[/latex]
- [latex]t = -\frac{1}{3}, \; \frac{2}{3}[/latex]
- [latex]x = \frac{1}{4}[/latex]
- [latex]x = \frac{\sqrt{3}}{2}[/latex]
- [latex]t = \pm 8[/latex]
- [latex]t = 6[/latex]
- [latex]x = 4[/latex]
- [latex]x=-2, 6[/latex]
- [latex]t=-8, \frac{27}{8}[/latex]
- [latex]t=-1, \frac{1}{27}[/latex]
- [latex]x=16[/latex]
- [latex]x = \frac{1}{81}, \frac{1}{16}[/latex]
- [latex]K=f(L) = (240)^{ \frac{5}{3}} L^{- \frac{2}{3}}[/latex]. [latex]f(100) \approx 430.2148[/latex]. This means in order for the production level of Sasquatchia to reach 300,000 Bigfoot Bullion with a labor investment of 100,000 hours, the country needs to invest approximately 430 Bigfoot Bullion into capital.
Section 4.4 Answers
- [latex](-\infty, -3] \cup [1, \infty)[/latex]
- [latex]\left(-\infty, -\frac{1}{4}\right) \cup \left(-\frac{1}{4}, \infty \right)[/latex]
- No solution
- [latex](-\infty, \infty)[/latex]
- [latex]\left\{2 \right\}[/latex]
- No solution
- [latex]\left[-\frac{1}{3}, 4 \right][/latex]
- [latex](0, 1)[/latex]
- [latex]\left(-\infty, 1-\frac{\sqrt{6}}{2} \right) \cup \left(1+\frac{\sqrt{6}}{2}, \infty \right)[/latex]
- [latex]\left(-\infty, \frac{5 - \sqrt{73}}{6} \right] \cup \left[\frac{5 + \sqrt{73}}{6}, \infty \right)[/latex]
- [latex]\left(-3\sqrt{2}, -\sqrt{11} \right] \cup \left[-\sqrt{7}, 0 \right) \cup \left(0, \sqrt{7} \right] \cup \left[\sqrt{11}, 3\sqrt{2} \right)[/latex]
- [latex]\left[-2-\sqrt{7}, -2+\sqrt{7} \right] \cup [1, 3][/latex]
- [latex](-\infty, \infty)[/latex]
- [latex](-\infty, -1] \cup \left\{ 0 \right\} \cup [1,\infty)[/latex]
- [latex][-6,-3] \cup [-2, \infty)[/latex]
- [latex](-\infty, 1) \cup \left(2, \frac{3+\sqrt{17}}{2}\right)[/latex]
- 2 seconds
- The rocket reaches its maximum height of 500 feet 10 seconds after lift-off.
- The hammer reaches a maximum height of approximately 13.62 feet. The hammer is in the air approximately 1.61 seconds.
- .
- The applied domain is [latex][0, \infty)[/latex].
- Answers May Vary
- Answers May Vary
- The height function is this case is [latex]s(t) = -4.9t^{2} + 15t[/latex]. The vertex of this parabola is approximately [latex](1.53, 11.48)[/latex] so the maximum height reached by the marble is 11.48 meters. It hits the ground again when [latex]t \approx 3.06[/latex] seconds.
- The revised height function is [latex]s(t) = -4.9t^{2} + 15t + 25[/latex] which has zeros at [latex]t \approx -1.20[/latex] and [latex]t \approx 4.26[/latex]. We ignore the negative value and claim that the marble will hit the ground after 4.26 seconds.
- Shooting down means the initial velocity is negative so the height functions becomes [latex]s(t) = -4.9t^{2} - 15t + 25.[/latex]
- [latex]y = |1 -x^{2}|[/latex]
Answer to Exercise 21 - [latex]\left(\dfrac{3 - \sqrt{7}}{2}, \dfrac{-1 + \sqrt{7}}{2} \right)[/latex], [latex]\left(\dfrac{3 + \sqrt{7}}{2}, \dfrac{-1 - \sqrt{7}}{2} \right)[/latex]
- [latex]D(x) = x^2 + (2x+1)^2 = 5x^2+4x+1[/latex] is minimized when [latex]x=-\frac{2}{5}[/latex]. Hence to find the point on [latex]y=2x+1[/latex] closest to [latex](0,0)[/latex] we substitute [latex]x = -\frac{2}{5}[/latex] into [latex]y=2x+1[/latex] to get [latex]\left(-\frac{2}{5}, \frac{1}{5}\right).[/latex]
- [latex]x = -\frac{6}{7}[/latex]
- [latex]x = 1, \; x = 2[/latex]
- [latex]t = -1[/latex]
- [latex]t = -6, \; x = 2[/latex]
- No Solution
- [latex]z = 0, \; z = \pm 2\sqrt{2}[/latex]
- [latex](-2, \infty)[/latex]
- [latex](-2, 3][/latex]
- [latex](-\infty, -1) \cup (0, 1)[/latex]
- [latex][0, \infty)[/latex]
- [latex](-\infty, -3) \cup (-3,2) \cup (4, \infty)[/latex]
- [latex]\left(-3, -\frac{1}{3} \right) \cup (2,3)[/latex]
- [latex](-1,0] \cup (2, \infty)[/latex]
- [latex](-\infty, -3) \cup (-2, -1) \cup (1, \infty)[/latex]
- [latex](-\infty, 1] \cup [2, \infty)[/latex]
- [latex](-\infty, -6) \cup (-1, 2)[/latex]
- [latex](-\infty, -3) \cup \left[-2\sqrt{2}, 0\right] \cup \left[2\sqrt{2}, 3\right)[/latex]
- No solution.
- [latex][-4, -1) \cup (-1,2][/latex]
- [latex](-\infty, -6) \cup (-6, -3] \cup [9, \infty)[/latex]
- [latex][-3,0) \cup (0,4) \cup [5, \infty)[/latex]
- [latex]\left(-1,-\frac{1}{2}\right] \cup (1, \infty)[/latex]
- [latex]f(x) \geq 0[/latex] on [latex](-\infty, 0) \cup [3, \infty)[/latex]
- [latex]f(x)[/latex] < 1 on [latex](0, \infty)[/latex]
- [latex]g(t) \geq -1[/latex] on [latex](-\infty, 1] \cup (2, \infty)[/latex]
- [latex]-1 \leq g(t)[/latex] < 1 on [latex](-\infty, 1] \cup (3, \infty)[/latex]
- [latex]r(z) \leq 1[/latex] on [latex](-\infty, -1] \cup (1, \infty)[/latex]
- [latex]r(z) > 0[/latex] on [latex](-\infty, 0) \cup (0,1) \cup (1, \infty)[/latex]
- The absolute minimum of [latex]y=\overline{C}(x)[/latex] occurs at [latex]\approx (75.73, 59.57)[/latex]. Given [latex]x[/latex] represents the number of game systems, we check [latex]\overline{C}(75) \approx 59.58[/latex] and [latex]\overline{C}(76) \approx 59.57[/latex]. Hence, to minimize the average cost, 76 systems should be produced at an average cost of \$59.57 per system.
- The width (and depth) should be 10.00 centimeters, the height should be 5.00 centimeters. The minimum surface area is 300.00 square centimeters.
- The width of the base of the box should be approximately 4.12 inches, the height of the box should be approximately 6.67 inches, and the depth of the base of the box should be approximately 5.09 inches. The minimum surface area is approximately 164.91 square inches.
- The dimensions are approximately 7 feet by 14 feet. Hence the minimum amount of fencing required is approximately 28 feet.
- .
- [latex]V = \pi r^{2}h[/latex]
- [latex]S = 2 \pi r^{2} + 2\pi r h[/latex]
- [latex]S(r) = 2\pi r^{2} + \frac{67.2}{r}, \;[/latex] Domain [latex]r > 0[/latex]
- [latex]r \approx 1.749\,[/latex]in. and [latex]h \approx 3.498\,[/latex]in.
- The radius of the drum should be approximately 1.05 feet and the height of the drum should be approximately 2.12 feet. The minimum surface area of the drum is approximately 20.93 cubic feet.
- [latex]P(t)[/latex] < 100 on [latex](-15, 30)[/latex], and the portion of this which lies in the applied domain is [latex][0,30)[/latex]. Given [latex]t=0[/latex] corresponds to the year 1803, from 1803 through the end of 1832, there were fewer than 100 Sasquatch in Portage County.
- [latex][-8,8][/latex]
- [latex][-1, 0] \cup [1, \infty)[/latex]
- [latex]\left(-\infty, \frac{1}{3} \right)[/latex]
- [latex]\left[ -\frac{\sqrt{5}}{2}, -1\right) \cup \left(1, \frac{\sqrt{5}}{2}\right][/latex]
- [latex]\left(-\infty, -\frac{3\sqrt{2}}{4} \right] \cup (-1,1) \cup \left[ \frac{3\sqrt{2}}{4}, \infty \right)[/latex]
- [latex]\left[ \frac{3}{4}, 1\right) \cup (1, \infty)[/latex]
- [latex]\left( -\infty, \frac{3}{5} \right] \cup (1, \infty)[/latex]
- [latex](-\infty, 2) \cup (2,3][/latex]
- [latex](2,6][/latex]
- [latex](-\infty, 0) \cup [2,3) \cup (3, \infty)[/latex]
- [latex](-\infty, -1)[/latex]
- [latex][4,7)[/latex]
- [latex]\left(0, \frac{27}{13} \right)[/latex]
- [latex](-\infty, 0) \cup (0,3)[/latex]
- [latex](-\infty, -4) \cup \left(-4, -\frac{22}{19}\right] \cup (2, \infty)[/latex]
